Solar Panels on City Hall?
Posted on
Yes, solar panels as in the electricity-producing squares people put on their roofs. I’ve seen a couple of houses here in Huber Heights, and I’m thinking it might make sense for the city to start using them, as well.
This is more of a cost-savings idea, rather than a green, environmentally-friendly idea, although that’s certainly a selling point as well.
And it would be good PR for the city, as well.
Right now, I’m not 100% sure it would actually be cost-savings - it’s looking more like it would be cost-neutral. The point of this post is to get my thoughts out there and make the case (or not) for my idea.
How Much Electricity Does City Hall Use?
Right now, I’m not sure. I’ve submitted a public records request for City Hall’s electric bills for all twelve months of 2020. You can check out the public record request online by entering the tracking number PRR21-050.
That said, Huber Heights keeps all its spending public via a financial portal. It’s not the simplest to use, but you can download a CSV file for all transactions in a given year. A CSV file, for those who don’t know, is essentially an Excel file (or Google Sheets).
It turns out the city made the following payments to DP&L (now AES Ohio) for 6131 Taylorsville Rd in 2020:
| date | payment |
|---|---|
| 1/27/2020 | $254.36 |
| 2/24/2020 | $263.94 |
| 3/23/2020 | $264.92 |
| 4/20/2020 | $254.00 |
| 5/26/2020 | $227.48 |
| 6/22/2020 | $322.64 |
| 7/20/2020 | $334.87 |
| 8/25/2020 | $320.24 |
| 9/28/2020 | $313.09 |
| 10/26/2020 | $266.23 |
| 11/23/2020 | $253.01 |
| 12/22/2020 | $260.11 |
Oh, 6131 Taylorsville Rd is the address for City Hall. That’ll be important later, too.
Anyway, the total paid to DP&L for 6131 Taylorsville Rd in 2020 was $3,334.89. That’s an average of $277.91 a month.
While this doesn’t tell me how much electricity City Hall uses, it gives me an idea:
Looking at my most recent DP&L bill, I paid $55.85 for 437 kWh of usage. That’s about $0.1278 per kWh.
Note: while I have - and you most likely do, too - have a “supply rate” and “supply total” listed somewhere on your bill, this does not include the “delivery charge” or any other charges. Also, be sure to shop your rate at the Energy Choice Ohio - Apples to Apples website!
So, if City Hall has a comparable rate, they’re using a little over 2,000 kWh a month on average.
How Much Would the Solar Panels Cost?
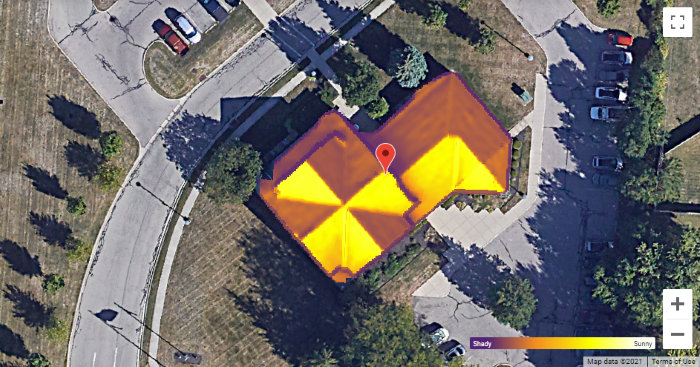
This one’s a little tougher, but I was able to get some insight from Google’s Project Sunroof. Heck, I’m even able to provide a direct link to the Project Sunroof page for 6131 Taylorsville Rd.
6131 Taylorsville Rd is the address for City Hall, remember?
According to Google, city hall has 1,486 hours of usable sunlight per year and 6,025 square feet available for solar panels.
You’ll also notice if you clicked on the link that I have the average monthly electric bill set to $250.
At the average monthly bill, Google recommends an 18.50 kW installation (which would only cover 1,304 square feet of the total 6,025 square feet available).
Would 18.5 kW be enough? Noting that there are 1,486 hours of usable sunlight per year, that means this unit would generate 27,491 kWh per year:
18.5kW × 1,486hours = 27,491kWh
Divide by twelve and we get an average of about 2,300 kWh generated per month.
Okay, enough with figuring out if Google’s numbers are right, what about the cost?
Unfortunately, you can’t just scroll down and look at the first “upfront cost” that Project Sunroof throughs at you. After all, that number includes a “Federal Investment Tax Credit” - but the city doesn’t pay taxes.
Note: There might be a way for the city to effectively claim the credit - see the following article: Time’s Running Out: Why Public Institutions Should Act Quickly to Maximize Solar Tax Credits.
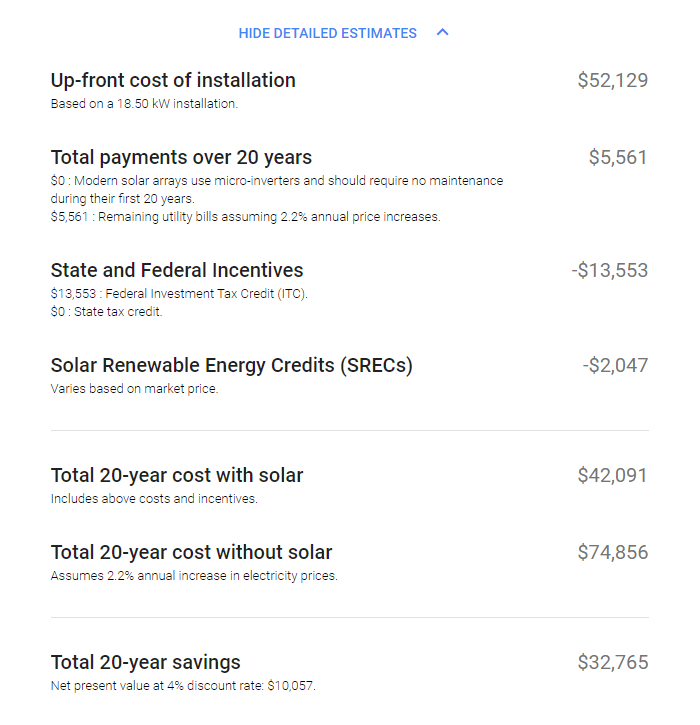
So you have to click on “show detailed estimates” and find the total “up-front cost of installation” - which is $52,129. It also has a few other interesting numbers:
For screen readers, or if you just want to copy-paste the data, I’ve put the data in table format here:
Up-front cost of installation
Based on a 18.50 kW installation.$52,129 Total payments over 20 years
$0 : Modern solar arrays use micro-inverters and should require no maintenance during their first 20 years.
$5,561 : Remaining utility bills assuming 2.2% annual price increases.$5,561 State and Federal Incentives
$13,553 : Federal Investment Tax Credit (ITC).
$0 : State tax credit.-$13,553 Solar Renewable Energy Credits (SRECs)
Varies based on market price.-$2,047 Total 20-year cost with solar
Includes above costs and incentives.$42,091 Total 20-year cost without solar
Assumes 2.2% annual increase in electricity prices.$74,856 Total 20-year savings
Net present value at 4% discount rate: $10,057.$32,765
So the upfront cost is $52,129. Google is estimating that the remaining net electric bill from DP&L would be $3,514 over twenty years (that $5,561 - $2,047). $3,514 averages monthly for 20 years is fifteen bucks, minus a quarter or two.
How Would the City Pay for the Solar Panels?
Bonds.
Of course, that just moves the question: how would the city pay for the bonds?
With the money they would have paid towards the electric bill.
But would it make sense?
Recently the city refinanced the Rose Music Center and financed the new Veterans Memorial with 20-year bonds. Those bonds have at most a 2% interest rate.
Or they’re in the process of refinancing/financing. Check out the Council Meeting on March 8, 2021 for more information.
A 20-year bond would have a principal payment of $2606.45 yearly, or $217.20 monthly.
$217.20 is less than the $277.91 paid per month on average in 2020.
However, the bond has interest. At 2% per year on $52,129, that’s an additional $1042.58 a year or $86.88 a month.
Including the $15 a month normal electric payment mentioned before, the would bring the total monthly cost to:
$217.20 + $86.88 + $15.00 = $319.08
Remember that bonds work differently than the type of debt you or I might have. Instead of paying towards the principal, the city puts the money we would have paid towards principal into a sinking fund. When the bond matures, it’s paid off using the money in the sinking fund. During the life of the bond, interest is paid on the entire balance.
There might be more costs involved in issuing and servicing a bond - I found an entire guide to municipal debt in Ohio online.
Why City Hall? Why Just City Hall?
Why city hall? Why not the police station? The court? Any one of our fire stations?
Simply put, city hall is just the building I researched. If any of the other buildings are better suited for solar panels in general, maybe those should get the panels.
Why just City Hall? Or - why just one building? Why not go all-in?
I think it would be best to ease into this sort of thing. If for some reason, solar panels are put on city hall and the entire thing is a disaster - well, it wouldn’t be as big a disaster as if the city went all-in.
If they do work well, then each building could have solar panels installed, as well.
Sources
- Huber Heights Financial Portal
- Huber Heights 2020 Financial Data as a CSV file
- Google Project Sunroof page for Huber Heights City Hall, 6131 Taylorsville Rd
- Time’s Running Out: Why Public Institutions Should Act Quickly to Maximize Solar Tax Credits
- Huber Heights Council Meeting on March 8, 2021 discussing the sales of bonds
- Guide to Municipal Debt in Ohio
Additional Reading
- School’s solar panel savings give every teacher up to $15,000 raises:
- Solar United Neighbors Solar for municipalities
- EPA Local Government Solar Project Portal
Final Thoughts
In my research for this, I found that the City Of Huber Heights does (did?) have an Energy Conservation Project.
The Request For Qualifications (RFQ) is dated May 1, 2020, and I found a City Council Meeting Agenda from October 12, 2020 that mentions the project. Plus there’s a WYSO article about it.
Other than that, I haven’t heard anything about it. It could make (and hopefully will make) the energy usage go down from what I found from 2020.
Update
Over the weekend, I received the electric bills from my public records request. To my surprise, City Hall used much more than I had estimated based on the payments - much more:
| month | kWh |
|---|---|
| January | 8,880 |
| February | 8,240 |
| March | 8,320 |
| April | 7,440 |
| May | 5,280 |
| June | 8,640 |
| July | 10,560 |
| August | 10,080 |
| September | 9,520 |
| October | 7,680 |
| November | 7,120 |
| December | 7,680 |
| Total | 99,440 |
99,440 kWh over 12 months is an average of almost 8,300 kWh a month. I had estimate they only used a little over 2,000 kWh a month.
Which means they’re getting a great rate. However, looking at the bill, it appears that the city isn’t being charged delivery. It’s a business bill, so it differs from my residential bill, so maybe that’s why.
Based on a 99,440 kWh usage and 1,486 hours of sunlight a year, that means city hall would need a 67 kW system:
99,440kWh / 1,486hours ≈ 67kW
However, the highest that Project Sunroof goes is a 41.3 kW system. That system is estimated to cost $113,782 before incentives.
So, with those numbers, that makes the financial sense not make sense.
The bills: